





增材制造技术越来越多地用于机器、运输工具和许多其他产品的制造。例如,在飞机制造中,金属 3D 打印为减轻重量开辟了全新的可能性,从而减少了煤油的消耗。>><> <<以前必须由数十个单独部件组装而成的部件现在可以直接制造成一个整体。增材制造技术的进步使越来越多的零件可以通过 3D 打印大批量生产。
用于增材制造的金属粉末必须符合高质量标准:粒度分布应较窄,并且必须尽可能精确地了解,以便控制材料在烧结过程中的行为。
MICROTRAC 颗粒分析仪非常适合测定用于增材制造工艺的金属粉末的粒度分布。下面介绍了合适的测量技术、一般考虑因素以及金属粉末颗粒表征的不同示例。
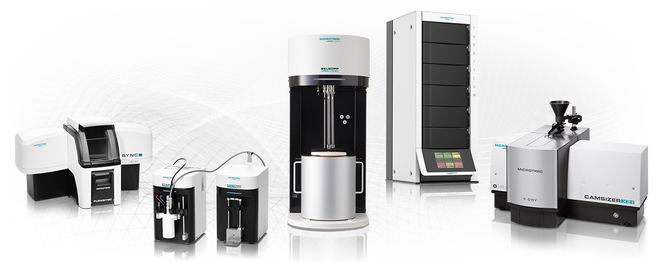
Microtrac提供满足各中颗粒分析技术的设备
金属粉末 &增材制造 Particle characterization methods in metallic powders and additive manufacturing
In additive manufacturing, the particle size range of the powder used usually lies between 20 and 80 μm. Dust, non-spherical particles or large, fused grains disturb the manufacturing process and can cause defects in the component.
Since only a small portion of the powder is incorporated in the component, there is inevitably a lot of powder left over which is reused for the next process. Whether the recycled powder still meets the high quality requirements is one of the most important questions in the analysis of metal powders.
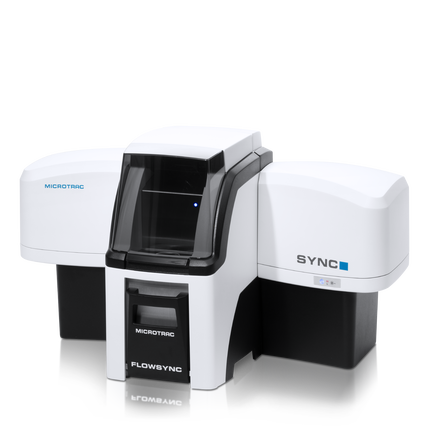
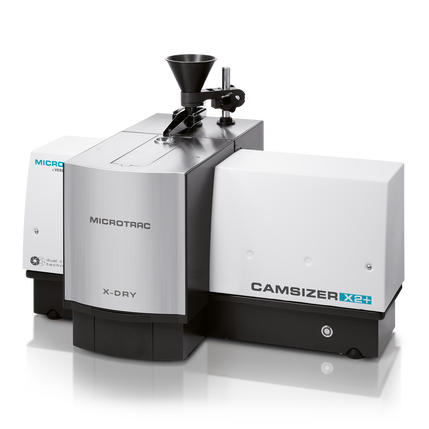
Microtrac offers two different technologies for the particle size characterization of metal powders: Laser Diffraction and Dynamic Image Analysis. Both methods provide a size distribution, but only imaging methods also detect the particle shape which is crucial for the suitability of a powder for additive manufacturing. Whereas Microtrac's CAMSIZER series is a range of dedicated image analysis devices, the SYNC combines Laser Diffraction and Dynamic Image Analysis in a unique way.
Another powder metallurgical process that is particularly suitable to produce small components with complex geometry in large quantities is Metal Injection Molding (MIM). With a particle size of typically 1-10 μm, the powders used for this process are even finer than those used for additive manufacturing. With Microtrac technology and equipment, however, even these fine powders can be analyzed without any problems.
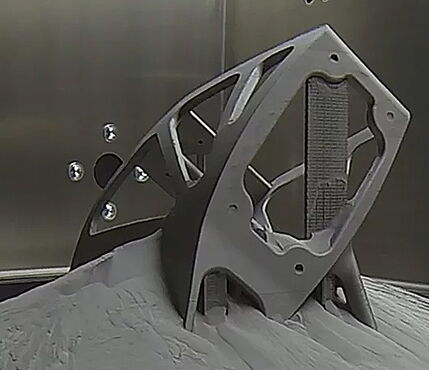
图 1:
借助选择性激光烧结等增材制造技术,可以将复杂组件制造成一个整体。所用粉末中只有一小部分成为产品的一部分,在重新使用之前可能需要准备和测试。图片:Premium Aerotec
Calculation of the AFS number. Note that the AFS number can only be calculated, if the correct size classes have been used. The selected sieves must be a contiguous subset of the ASTM mesh sieve series.
金属粉末 &增材制造 动态影像分析 in metallic powders and additive manufacturing
使用 Dynamic Image Analysis,可以生成一个粒子流,该粒子流被引导通过相机系统。生成的颗粒图像直接传输到 PC 并进行实时评估。样品在气流或液体中移动。
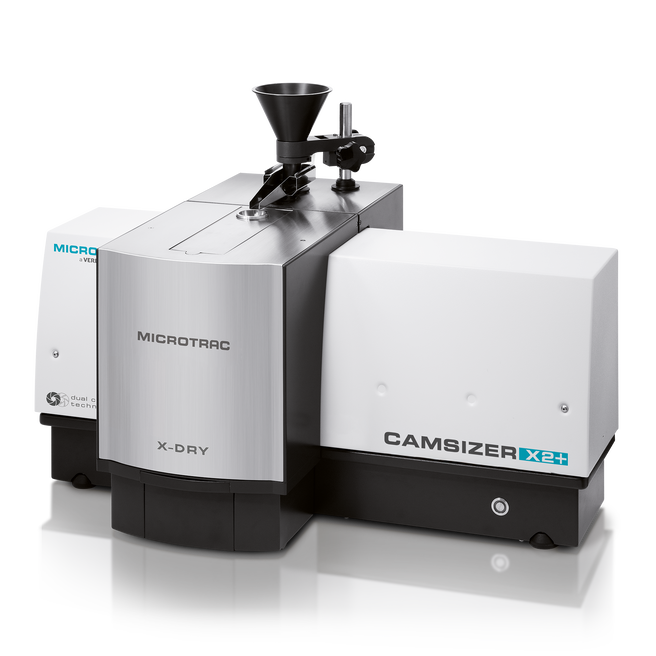
CAMSIZER X2 的测量范围为 0.8 μm 至 8 mm,图像采集速率超过 300 帧/秒,特别适用于增材制造所需的精细金属粉末。
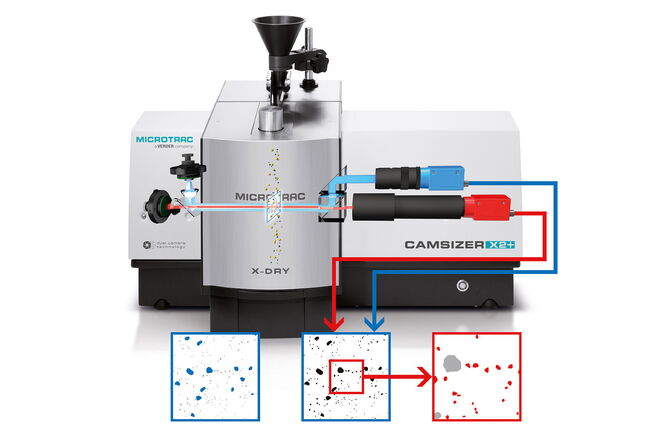
图 2:
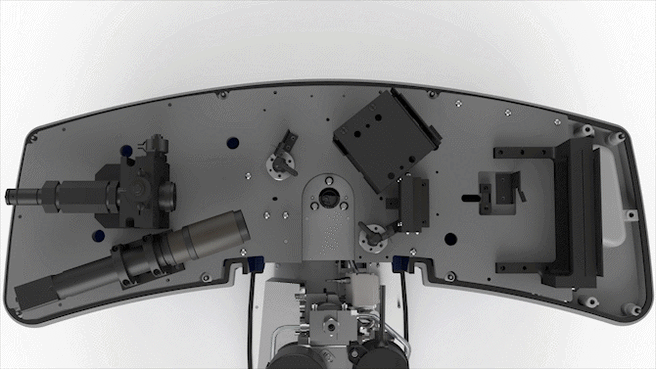
CAMSIZER X2 工作原理。通过使用两个具有不同放大倍率的相机,可以覆盖较宽的测量范围。在理想测量条件下,可以同时分析大颗粒和小颗粒。
金属粉末 &增材制造 激光衍射与图像分析相结合 Particle characterization methods
激光衍射是许多行业中确定 粒度分布的标准方法。该技术还可以分析气流中的颗粒或液体中的悬浮液。
测量方法基于激光从不同大小的颗粒以不同角度衍射或散射的原理。尺寸分布的计算基于对散射光图案的分析。
测量方法的优势在于其高度灵活性、易于作以及 10 nm 至 4 mm 的极宽测量范围。然而,激光衍射并不适合确定颗粒形状。>>因此,麦奇克为其强大的激光衍射分析仪 SYNC 配备了一个基于动态图像分析原理的附加相机模块。该方法使用与散射光分析相同的测量池和色散系统。
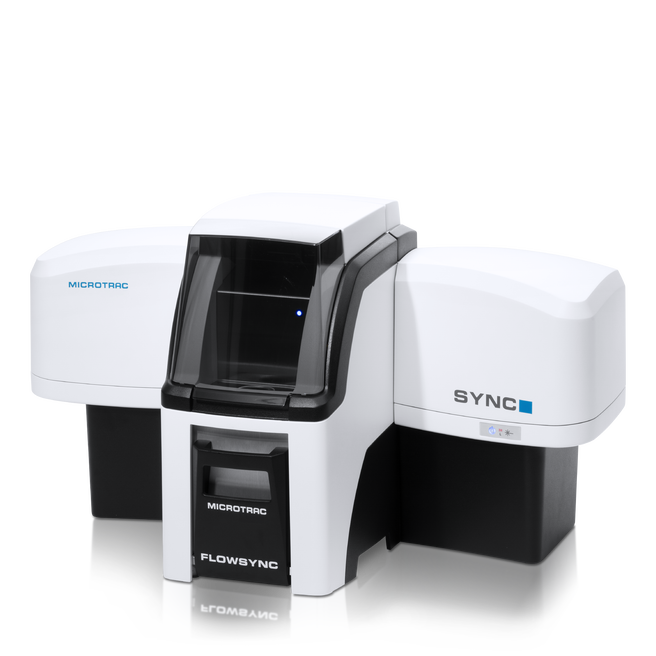
SYNC 是一款带有集成成像模块的高端激光衍射分析仪。
案例 通过激光衍射和图像分析表征的金属粉末
使用 CAMSIZER X2 和 SYNC 两种测量仪器分析了四种金属粉末。粒度分布显示出相同的趋势:样品 1 和 2 是相对较细的粉末,中位数约为 30 μm,而样品 1 包含颗粒 20 μm,样品 2 中缺失。值得注意的是,在 CAMSIZER 分析中,样品 1 的细小部分以明显分离的方式(双峰)测量,而激光结果显示逐渐过渡。样本 3 和 4 较粗糙,但彼此相似。图 4 和图 5 显示了图像分析和激光衍射的尺寸结果。
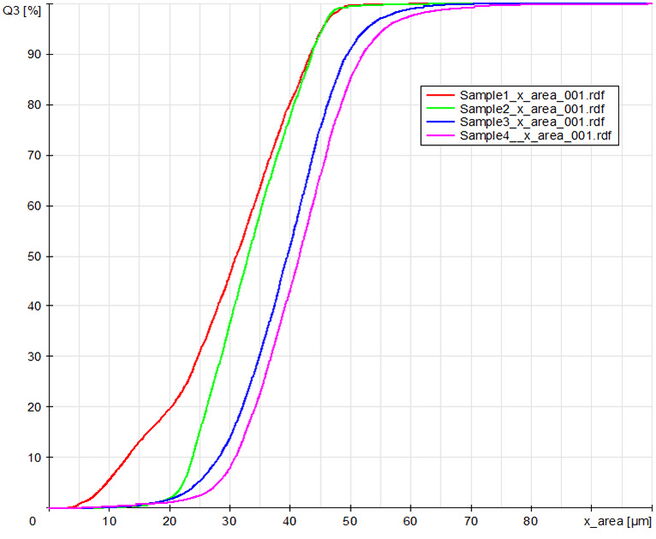
图 4:
使用 CAMSIZER X2 分析四种金属粉末的粒度分布(粒度定义 xarea)。
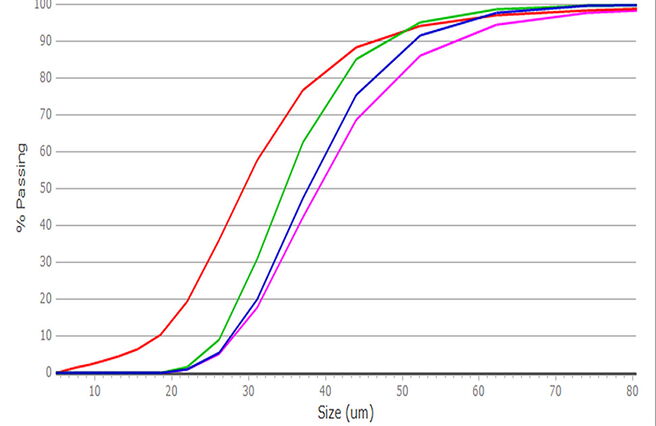
图 5:
{LL::applications.knowledgebase.metal_powders.fig5}}
通过使用 CAMSIZER X2 进行图像分析,可以根据每个颗粒投影的等积圆 (xarea) 的宽度、长度和直径确定每个样品的三种尺寸分布。如果颗粒近似呈球形,如样品 1 和 2,则这三条分布曲线几乎全等。如果样品包含非球形颗粒,如材料 3 和 4 中,则长度、宽度和外面积的分布会有所不同。粒子形状越不规则,曲线之间的距离就越远。激光衍射不区分长度和宽度,所有测量信号都与等效球体的直径有关。因此,尺寸分布介于图像分析结果的长度和宽度分布之间(下面的图 6)。
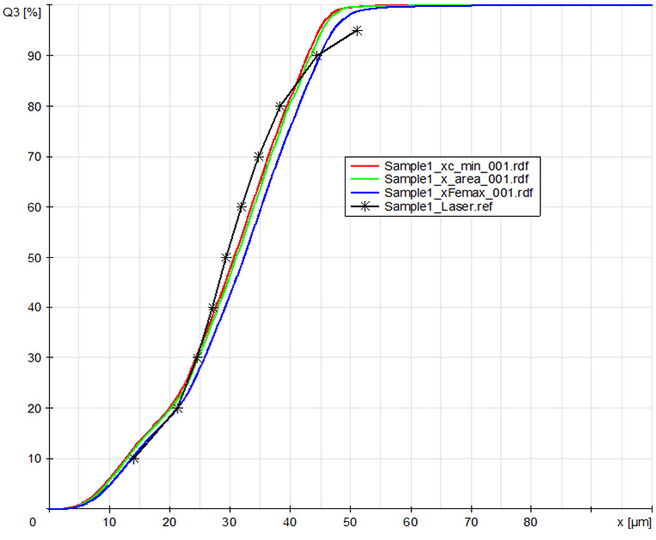
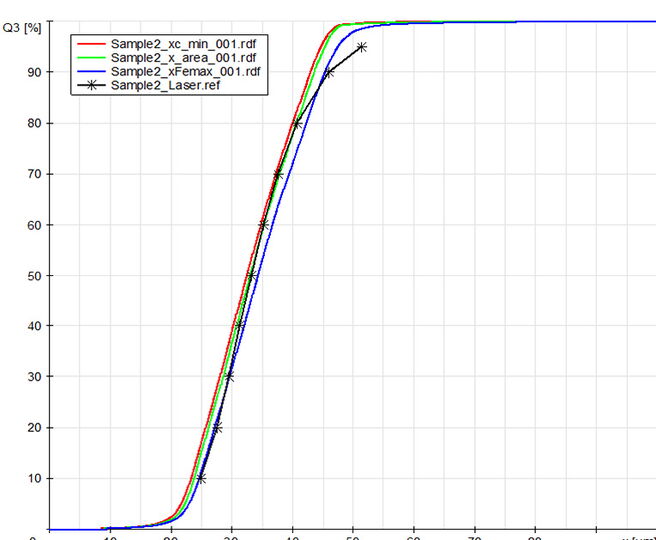
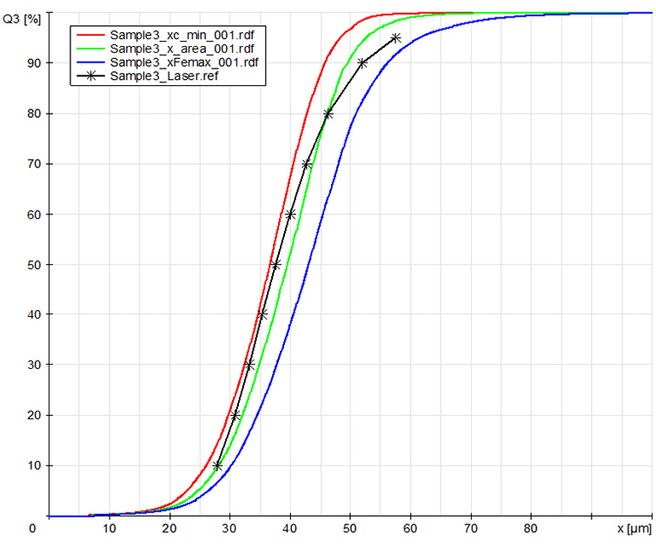
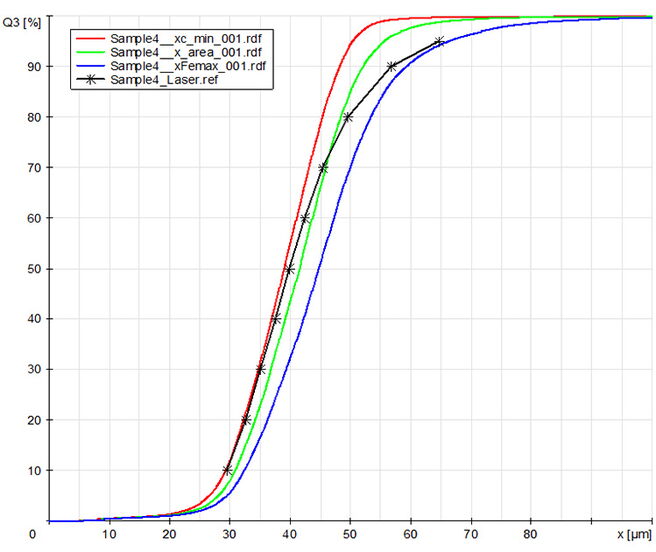
图 6:
CAMSIZER X2 图像分析和 SYNC 激光衍射对所有四个样品的比较。CAMSIZER 颗粒宽度(红色)、CAMSIZER 颗粒长度(蓝色)、CAMSIZER xarea(绿色)、SYNC 激光衍射(黑色)。
样品 2 在 50 μm 处筛选,因此不应存在超过此尺寸的颗粒。在 CAMSIZER 分析中,分布遵循预期的行为:曲线在 50 μm 处达到 100%。只有在长度测量的情况下,才会检测到一些大于 50 μm 的 %。由于颗粒通过筛子的孔径,其投影面积最小,因此这些颗粒的宽度小于 50 μm,但它们仍然可以更长!
在这里,激光测量甚至显示大约 5% 的颗粒大于 50 μm。但是,如果在 SYNC 分析仪上使用图像评估功能,则 50 μm 处的急剧分离在这里也很明显。这表明,通过将图像评估功能与 SYNC 一起使用,可以以与 CAMSIZER 相似的精度检测分布上限。没有集成图像评估的激光分析仪没有这种可能性!
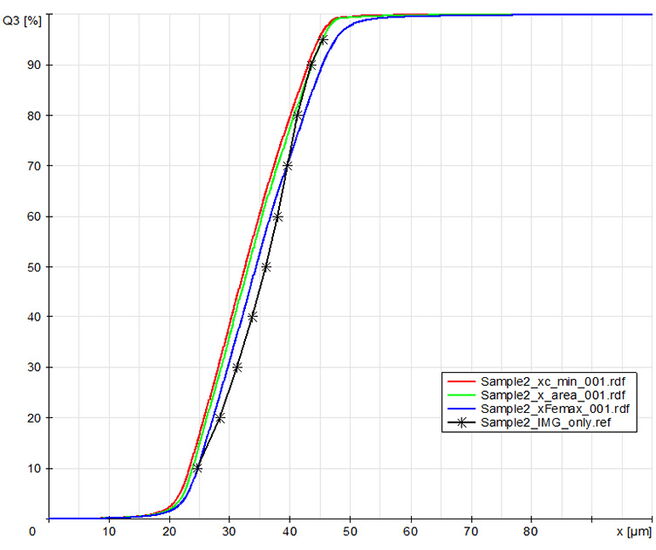
图 7:
CAMSIZER X2 和 SYNC Image Analysis 对样品 2 的比较。CAMSIZER 颗粒宽度(红色)、CAMSIZER 颗粒长度(蓝色)、CAMSIZER x area(绿色)、SYNC Image Analysis(黑色)。
案例 超大颗粒
Many production processes, including additive manufacturing, are sensitive to small quantities of large particles (oversize). In metal powders, for example, these large particles can lead to cavities or weak points in the end product.
Simply determining the average or mean particle size is not enough to predict manufacturing performance. The volume of particles larger than a certain limit size must be carefully monitored. It is possible to define a specification that no more than a small fraction of the particles can be larger than a critical size.
For example, you could require that no more than 0.01% by volume of the particles are larger than 200 microns.In this measurement example, a sample of metal powder with different amounts of impurities (oversize particles) was gravimetrically prepared and the resulting size distributions were measured to illustrate how the high-speed dual camera system of the CAMSIZER X2 can be used to find small amounts of impurities with large particles
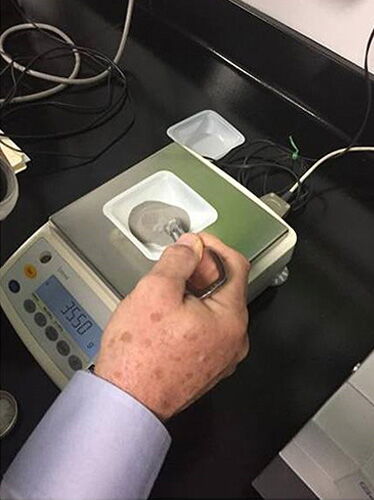
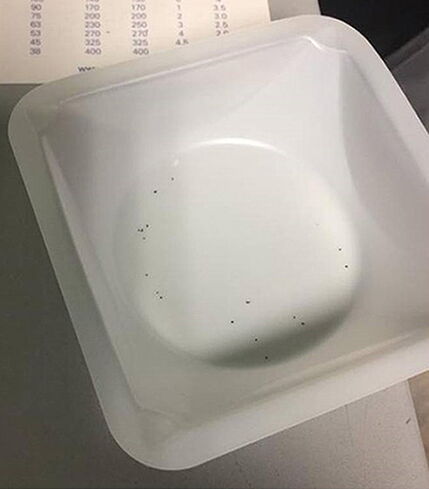
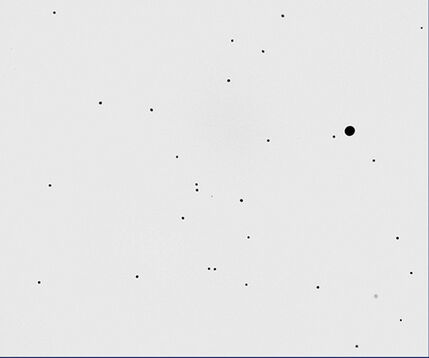
图 8:
使用 CAMSIZER X2 检测超大尺寸。左:粉末的称重;中:添加确定数量的大件;右图:分析过程中采集的 CAMSIZER X2 图像,显示许多小金属粉末颗粒和一个超大块
A metal powder sample was first sieved through a 200 μm test sieve to ensure the removal of large contaminants. This screened powder was then weighed and a small amount of large particles was added in a controlled manner. This resulted in a series of samples with known amounts of impurities. Concentrations were 0.005%, 0.01%, 0.02%, 0.05%, 0.1%, 0.2% and 1% (mass % each). The sample quantities for analysis were approximately 35-40 grams. Fig. 9, Fig. 10, and the table show how accurately the oversize grain can be detected with the CAMSIZER.
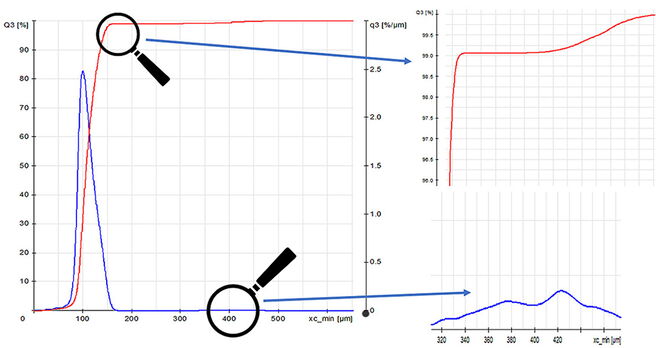
图 9:
添加 1% 超大尺寸的金属粉末的 CAMSIZER X2 结果:分布在 50 μm 和 200 μm 之间。大件表示为第 3 季度累计分配中的一个步骤,为 99%(红色)。它也在 q3 频率分布(蓝色)中可见。
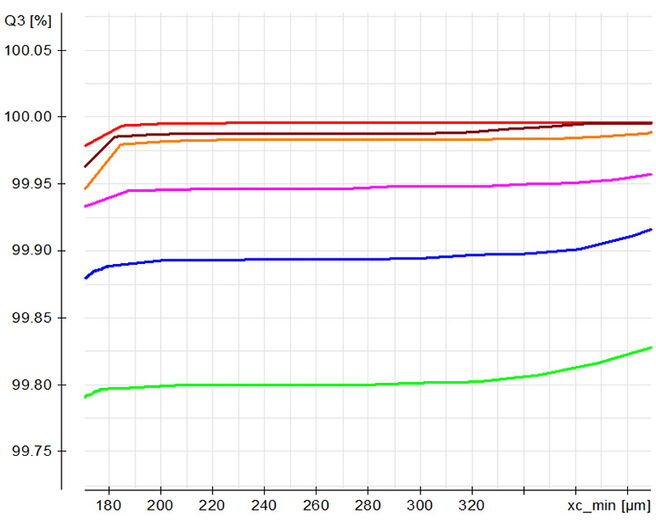
图 10:
Q3 - 添加量过大的金属粉末分布:0.2 %(绿色)、0.1 %(蓝色)、0.05 %(紫色)、0.02 %(橙色)、0.01 %(棕色)和 0.05 %(红色)
| % 超大尺寸>添加 200 μm | % 超大 >200 μm 由 CAMSIZER X2 检测到 | 区别 |
|---|---|---|
| 0.005 % | 0.005 % | 0.000 % |
| 0.010 % | 0.013 % | 0.003 % |
| 0.020 % | 0.019 % | 0.001 % |
| 0.050 % | 0.054 % | 0.004 % |
| 0.100 % | 0.107 % | 0.007 % |
| 0.200 % | 0.201 % | 0.001 % |
| 1.000 % | 0.936 % | 0.064 % |
In Laser Diffraction, it is assumed that under favorable conditions oversized particles can be detected if the percentage is >2 % by volume. Laser diffraction evaluates a signal generated by all particles simultaneously. This is therefore referred to as a collective measurement method, as opposed to an individual particle measurement method such as image analysis in which each particle detected generates a measurement value. In laser diffraction, if the proportion of a certain fraction is too small, the contribution of these particles to the total scattered light signal is also too small to be distinguishable from background noise. This situation cannot be compensated for by measuring larger sample quantities.
The combination of image analysis and laser diffraction improves the detection probability of impurities, but the performance here does not come close to that of a specialized dynamic image analyzer like the CAMSIZER X2. This is mainly due to the image acquisition rate of the CAMSIZER X2 which is 14 times higher. The dispersing system, sample feed and instrument setup of the SYNC are optimized to generate high quality scattered light data in a short time with the additional possibility of image acquisition. The entire hardware of the CAMSIZER X2, i.e. dispersion, sample feed, light sources and cameras, is optimized to acquire and evaluate many images in a short time. The number of particles evaluated, as well as the total amount of sample material used is considerably larger with the CAMSIZER X2.
Nevertheless, the SYNC is clearly superior to other laser analyzers with regard to the detection of oversized particles thanks to the advanced image evaluation.
案例 Satellites
Due to production conditions, particles can be fused together in gas-atomized metal powders. Aggregates of several spherical particles are considerably larger and can be removed by sieving. More problematic are so-called satellites. These are small particles that adhere to larger ones. Figure 11 shows some of the images taken by the CAMSIZER X2 of particles with satellites. Since these have a negative influence on the flow and sintering behavior of the metal powder during additive manufacturing, the metal powder must not contain too many satellites.
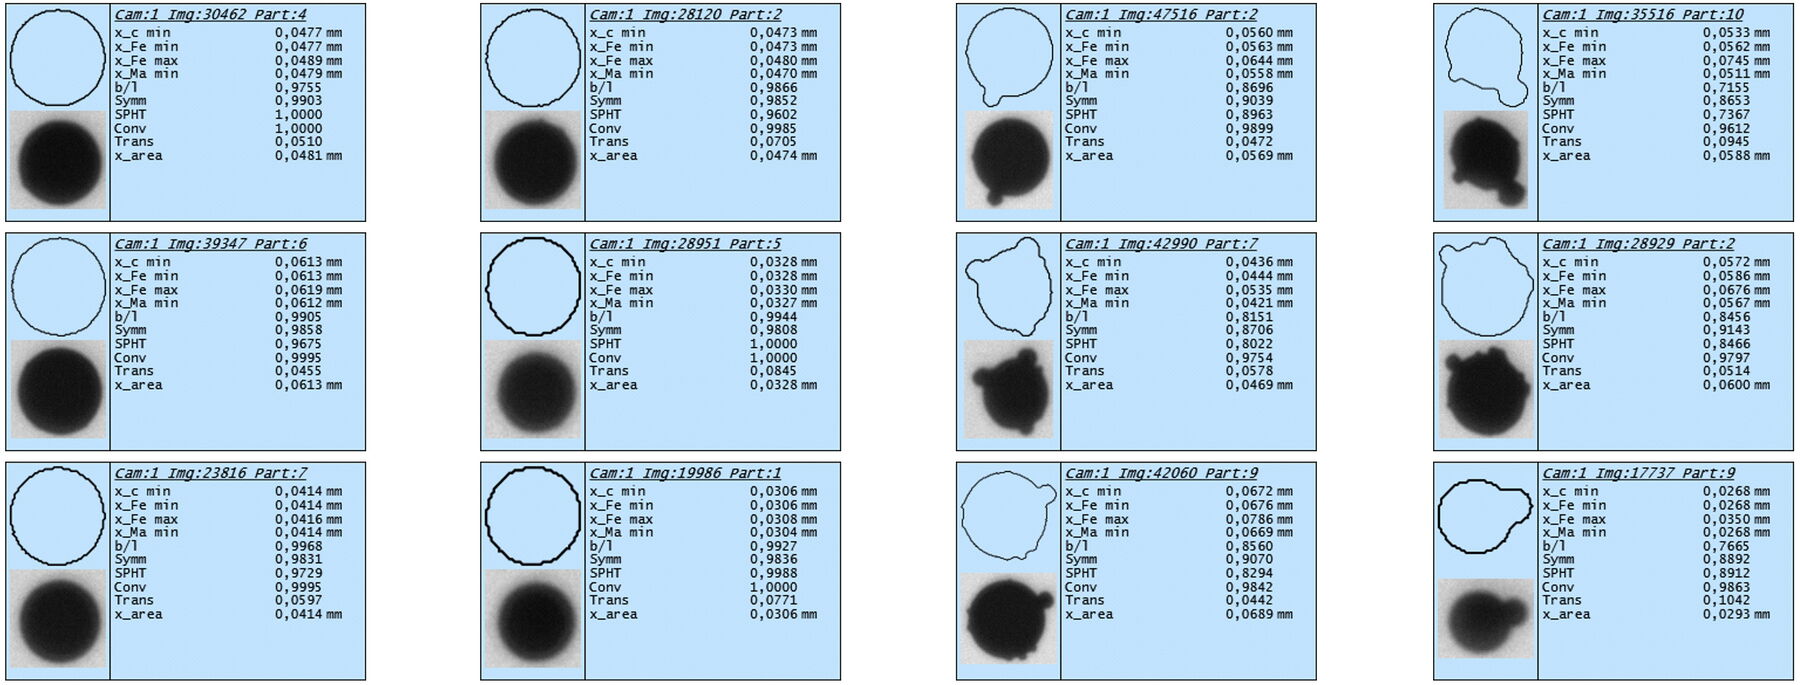
图 11:
CAMSIZER X2 图像,几乎完美的圆形金属颗粒(左)和带有卫星的颗粒(右)。大小和形状数据显示在每个粒子的旁边。通过选择适当的形状参数和阈值,可以测量样品中有害颗粒的数量。
图 11:
CAMSIZER X2 图像,几乎完美的圆形金属颗粒(左)和带有卫星的颗粒(右)。大小和形状数据显示在每个粒子的旁边。通过选择适当的形状参数和阈值,可以测量样品中有害颗粒的数量。
The measurement example shows the comparison of the particle shape of samples 2 and 4 from Fig. 6. Sample 4 contains significantly more non-spherical particles or satellites. This is shown by the Q3 distribution of the shape parameters aspect ratio and symmetry. The further the curve in the diagram lies to the right (values closer to 1), the more symmetrical or round the particles are.
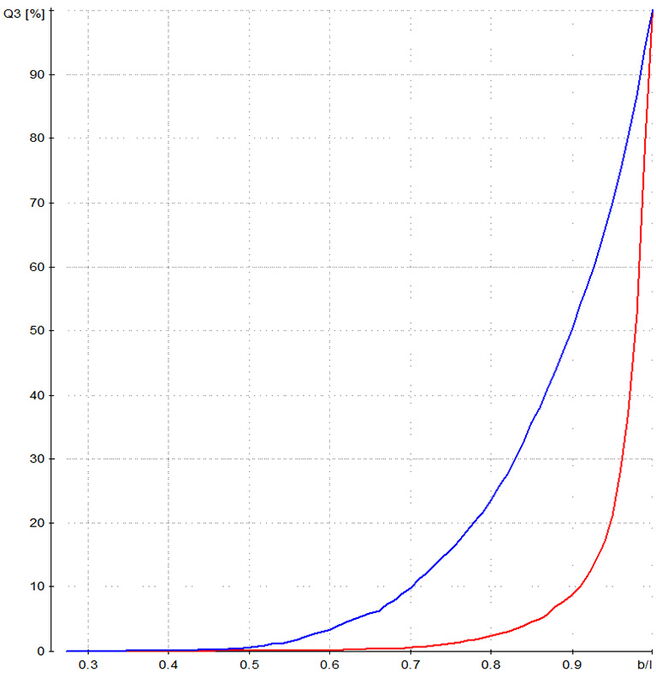
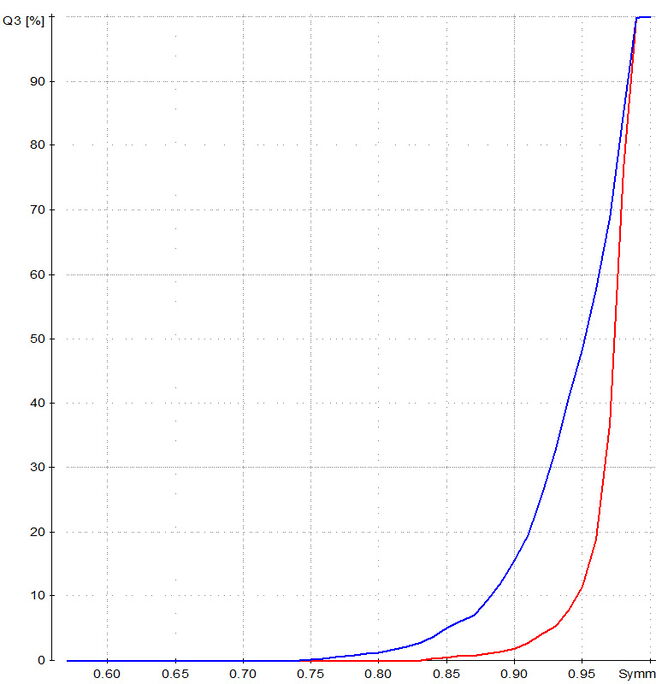
图 12:
CAMSIZER X2 形状分析。纵横比(宽度除以长度,左侧)和对称性(右)。
样本 2(红色)和样本 4(蓝色)。
The image evaluation of the SYNC can also be used to describe the particle shape and to make a statement about the content of satellites and non-spherical particles. Fig. 13 shows scattergrams of sample 2 and sample 4, where each point represents a measured particle. Fig. 14 shows examples of some spherical and non-spherical particles as recorded by the SYNC camera.
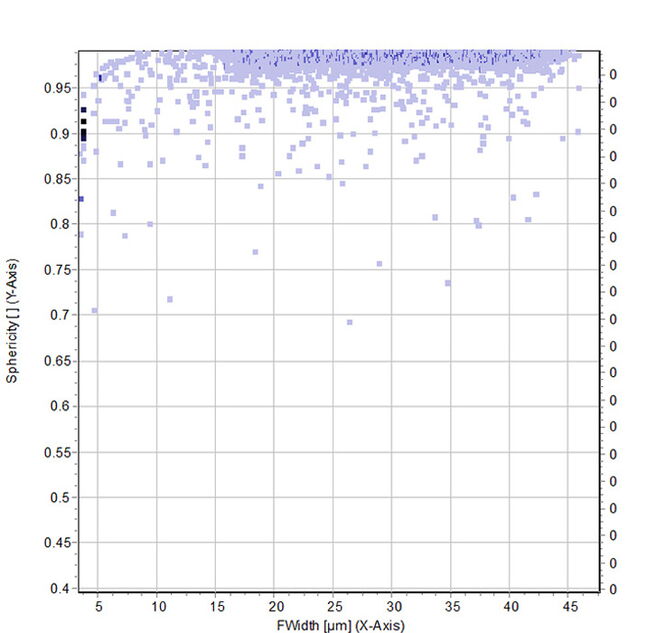
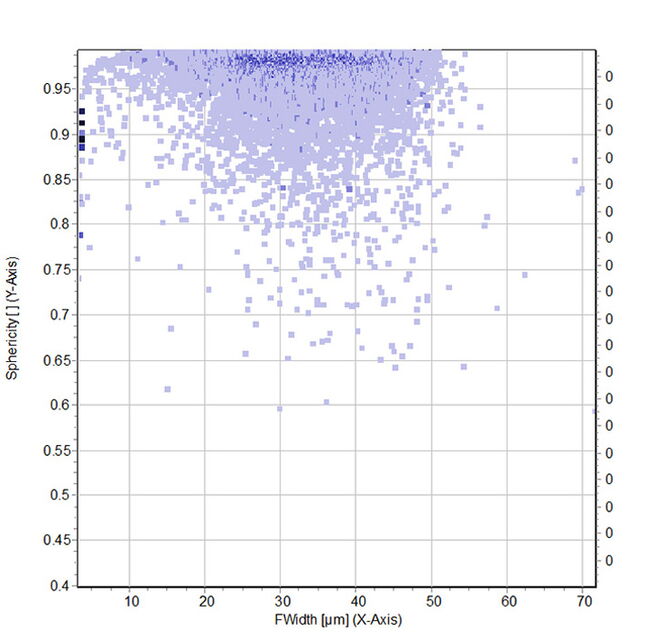
图 13:
SYNC 图像分析 – 样品 2(左)和样品 4(右)的大小和球度散点图。几乎没有球形度的颗粒 样品 2 中存在 0.95。完美球体的球度为 1。
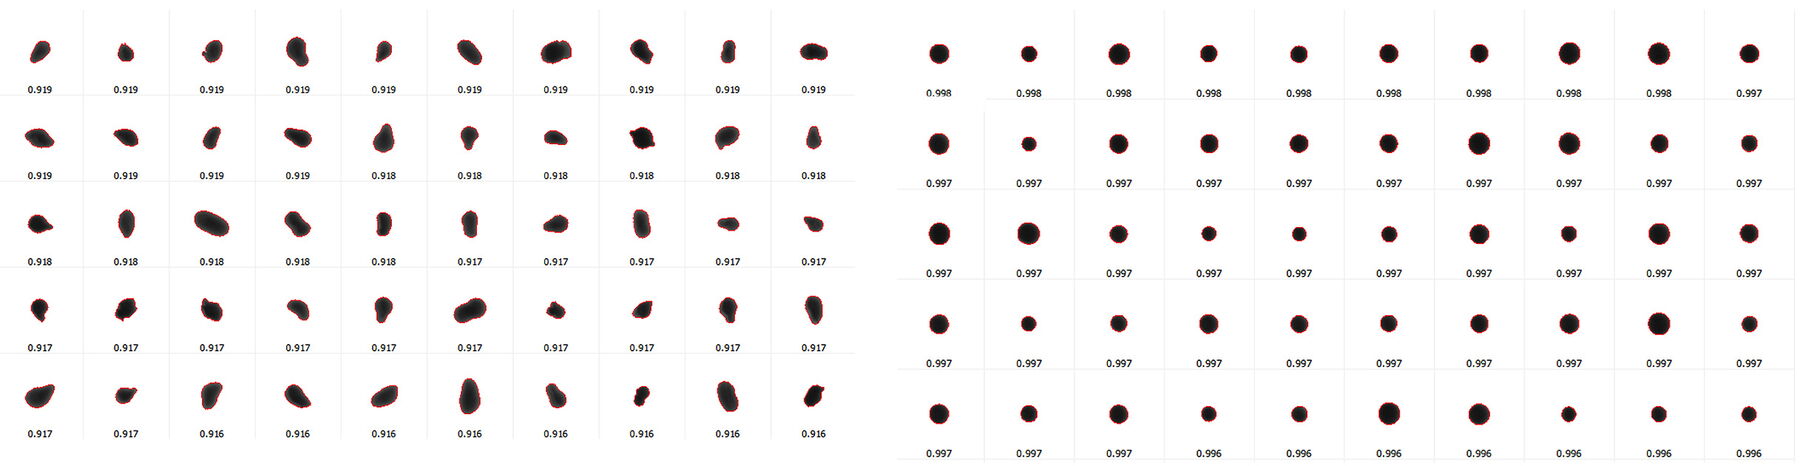
图 14:
同步非球形金属粉末颗粒(左)和圆形颗粒(右)的图像评估。
Both instruments can detect differences in particle shape and clearly distinguish a sample with many satellites from a sample with few satellites. Which shape parameter is most suitable depends on the application and the resolution of the measuring instrument.
The user has to define suitable parameters and threshold values in the course of application development: Which symmetry and sphericity characterize a particle as "faulty", how many "faulty" particles may the material contain so that the production process still functions acceptably? Experience is required.
The easiest way is to analyze and compare samples of different quality levels, e.g. "excellently suitable", "well suitable", "just about suitable" and "unsuitable". This gives an overall picture when comparing and interpreting the data. Then, any new unknown samples can be immediately assessed with regard to their suitability for additive manufacturing.
金属粉末 &增材制造 Method Comparison and Summary
The measurement examples show that laser diffraction is suitable for fast and reliable determination of the particle size distribution of metal powders in additive manufacturing applications. But this is not enough for many requirements. The particle shape can only be described with imaging techniques. The recorded particle images immediately provide the user with qualitatively and quantitatively valuable additional information about the sample material.
This is possible with a combined device like the SYNC. Nevertheless, the dispersion system and the measuring procedure is optimized for laser analysis, so that only a 100% image analysis instrument, like the CAMSIZER X2, can fully utilize the advantages of the method.
The CAMSIZER X2 evaluates larger sample quantities and analyzes more images per second which leads to higher statistical certainty and significance of the results. However, if also finer particles are to be measured, the flexibility of the diffraction method with the capability of measuring particles < 1 μm could make the SYNC the more suitable device.
Both methods can analyze the samples either dry in an air stream or wet in a suspension. With the CAMSIZER X2, dry measurement would be preferable, since the advantages of the large sample quantity are particularly evident here. With SYNC, wet measurement would tend to be the method of choice.
MICROTRAC 产品 & 联系
我们的专家团队将很乐意就您的应用和我们的产品向您提供建议。 {{LL:applications.knowledgebase.metal_powder.contact}